
Home » Uncategorized
Category Archives: Uncategorized
Base R vs Advanced R
R is a powerful programming language for statistical analysis, data manipulation, and visualization. While Base R provides fundamental tools for these tasks, Advanced R extends the language’s capabilities, allowing users to write more efficient, modular and scalable code.
Base R
Base R refers to the core functionalities that come with R upon installation. It includes:
Key Features
- Built-in Functions and Packages:
- Statistical methods, mathematical operations, and basic data manipulation tools.
- E.g.,
mean(),sum(),plot(),lm().
- Built-in Datasets:
- Access to datasets like
mtcars,iris, etc., using thedata()function.
- Access to datasets like
- Data Manipulation:
- Operations such as filtering, subsetting, merging, and reshaping data using functions like
subset(),merge(), andreshape().
- Operations such as filtering, subsetting, merging, and reshaping data using functions like
- Visualization:
- Creating plots using
plot(),hist(),boxplot(), etc.
- Creating plots using
- Basic Programming Constructs:
- Loops (
for,while), conditionals (if,else), and functions (function).
- Loops (
- Statistical Analysis:
- T-tests, linear regression (
lm()), ANOVA (aov()), and more.
- T-tests, linear regression (
Advantages
- Easy to Learn: Suitable for beginners.
- Comprehensive: Includes tools for most basic statistical tasks.
- No Dependencies: Does not require additional libraries or installations.
Limitations
- Limited Efficiency: Can be slower for large datasets or complex tasks.
- Less Concise: Operations often require more code compared to modern packages.
- Basic Visualizations: Base plotting system lacks advanced features like interactive plots.
Advanced R
Advanced R refers to using additional R capabilities or third-party packages to perform more sophisticated tasks, write efficient code, or handle complex data workflows.
Key Features
1. Packages:
- Using specialized libraries like
dplyr,ggplot2,tidyr,shiny, andcaretfor advanced data manipulation, visualization, and machine learning.
2. Data Manipulation with Tidyverse:
- Tools like
dplyrandtidyrmake data manipulation more intuitive. - Example:
library(dplyr)
mtcars %>%
filter(mpg > 20) %>%
summarize(avg_hp = mean(hp))
3. Advanced Visualization:
- Use
ggplot2for layered and customized plots. - Example:
library(ggplot2)
ggplot(mtcars, aes(x = hp, y = mpg)) +
geom_point(color = "blue") +
labs(title = "HP vs MPG", x = "Horsepower", y = "Miles per Gallon")
4. Efficient Programming:
- Functional programming with
purrr. - Parallel processing for faster computation using packages like
parallelorfuture.
5. Interactive Applications:
- Create web apps and dashboards with
shiny.
6. Advanced Statistical Modeling:
- Machine learning and predictive modeling using packages like
caret,xgboost, orrandomForest.
7. Handling Big Data:
- Work with large datasets using packages like
data.tableorsparklyr.
8. Object-Oriented Programming (OOP):
- Use R’s OOP systems (S3, S4, and R6) for creating modular and reusable code.
Differences Between Base R and Advanced R
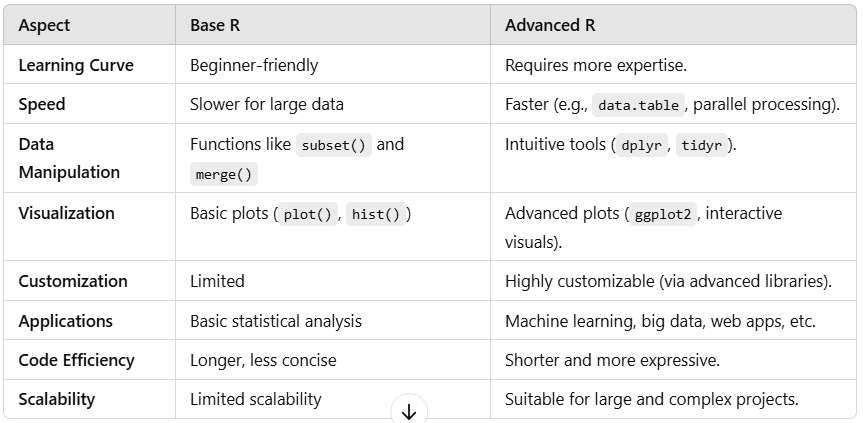
Most standard statistical and data analysis tasks can be performed with Base R. For example:
- Descriptive statistics (
mean(),sd()). - Regression analysis (
lm()). - Data visualization (
plot(),boxplot()).
However, for tasks involving large datasets, interactive dashboards, or modern machine learning, Advanced R with specialized libraries is more efficient and user-friendly.
Examples of Base R and Advanced R
Base R Example: Basic Plotting
plot(mtcars$hp, mtcars$mpg, main = "HP vs MPG", xlab = "Horsepower", ylab = "Miles Per Gallon")
Advanced R Example: ggplot2 for Advanced Visualization
library(ggplot2)
ggplot(mtcars, aes(x = hp, y = mpg)) +
geom_point(color = "blue") +
labs(title = "HP vs MPG", x = "Horsepower", y = "Miles Per Gallon")