Generally, the pharmaceutical industry businesses are involved commercially with research & development, manufacturing operations, marketing and distribution of drugs, biologics, vaccines either or both generic and branded formulations. The drugs offered by these pharmaceutical companies play a key role in improving health, preventing diseases and increasing the lifespan of patients. The products includes biologically-derived, over-the-counter (OTC), prescription-based products. The pharmaceutical industry is capital intensive and highly regulated. However, the industry is witnessing a high demand for innovations that would help reduce life-threatening conditions and diseases and revolutionize the quality of healthcare. Additionally, the increase in the number of middle-class populations in both developed and emerging countries and higher disposable income and expectation of better healthcare solutions are driving the growth of the industry. The top priority in any health system is delivering of medicine as a strategic product. In the present context of a health-conscious society, management of pharmaceutical supply chains has become more complex because it involves the life-saving interest of human being and requires the participation of different stakeholders such as pharmaceutical manufacturers, wholesalers, distributors, customers, information service providers and regulatory agencies. The key focus areas for a successful supply chain management in pharmaceutical industry would be to make use of assets and resources, to engender profits, to boost shareholder value, and to optimistically respond to customer demand. Other benefits include:
-
- Quicker response time and fulfillment rates
-
- Shorter lead times
-
- Greater productivity
-
- Lower costs
-
- Reduced inventory through out the chain
-
- Improved forecasting precision
-
- Fewer suppliers and shorter planning cycles
In taking on these challenges, one of the most powerful strategies available to pharmaceutical companies is reinventing the supply chain. We can address these issues with insights from the historical data.
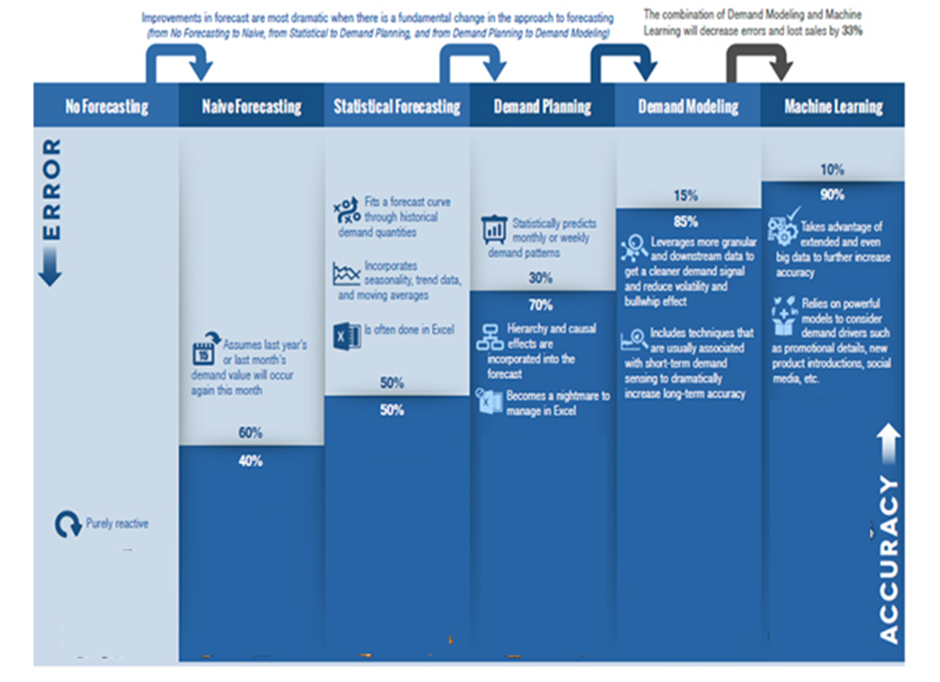
Adopt to good forecasting strategies
Pharmaceutical companies today tend to embrace a one-size-fits-all approach to the supply chain, maintaining high levels of inventory and high service levels for virtually all their drugs, no matter what the demand patterns (or volatility in consumer demand) may be. This can be an acceptable model for high-margin products in a homogeneous market, but it will not suffice in today’s lower-margin segments and disparate environments. Large-scale shifts in the competitive landscape have escalated the importance of successful product launches and have increased demand volatility and SKU proliferation. All of these conditions require strong demand planning capabilities to properly navigate these shifts. Demand and capacity planning is an important method that helps companies to monitor and improve their inventory management. The growing popularity of demand and capacity planning can be attributed to its ability to simplify the logistics value chain by integrating smarter demand forecasting and predictive analytics into the process of capacity planning. Improvement in forecast accuracy drives lesser inventory, higher On Time in Full (OTIF), shorter inventory days, lesser storage costs, lesser freight costs, shorter cash to cycle times and higher margins. Even a few points of accuracy improvement at the region level can generate immediate supply chain savings. With a target improvement of 10% – 15% on forecasting accuracy would result in a significant cost reduction and increased turnover rate. This also creates a ground for good synergy between sales, production and planning teams.
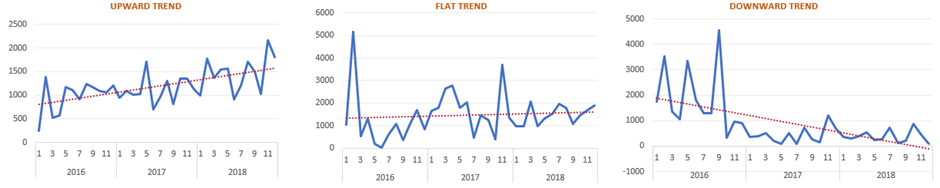
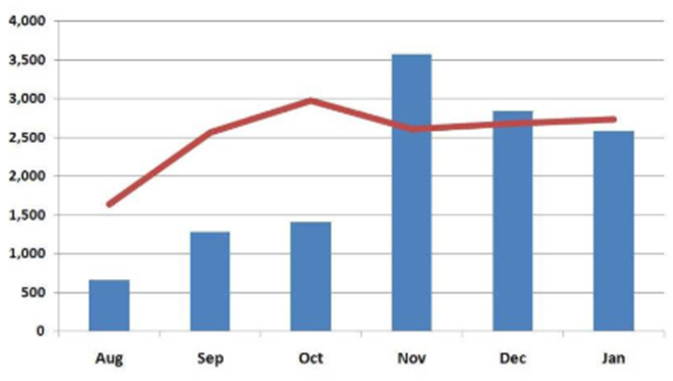
Statistical approach like time series analysis using a mix of models based on data such as Exponential Smoothing methods, Auto Regressive Integrated Moving Average univariate models & Vector Auto Regression multivariate models. The plots depict some trends and patterns over time.
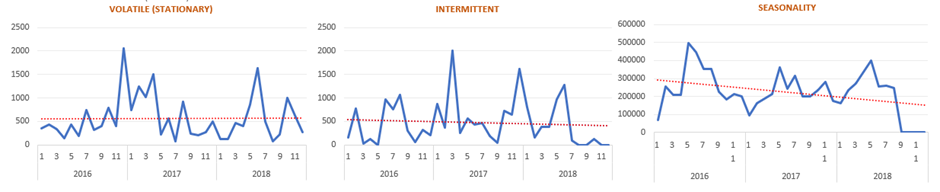
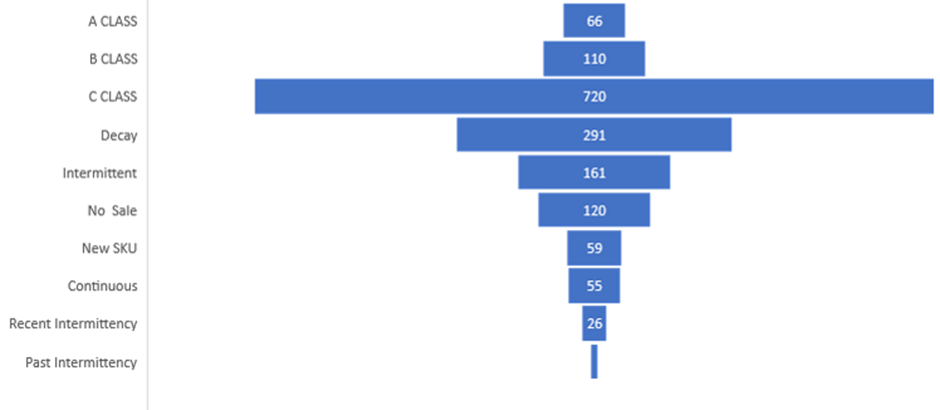
The ABC-XYZ-LMN analysis
The products (SKUs) can be categorized based on the Volume, Variability and Intermittency. The ABC-XYZ-LMN analysis is a very popular tool in supply chain management. It is based on the Pareto principle, i.e. the expectation that the minority of cases has a disproportional impact to the whole. This is often referred to as the 80/20 rule and here we have 80/15/05. The intermittent products are the most difficult to predict while the continuous products are quite easy to predict. The challenge with most of the Enterprise Resource Planning (ERP) applications is that they are totally outdates and do not accommodate latest prediction methods. Ideally, data can be extracted from such ERP applications and machine learning algorithms can be deployed to automatically predict based on the historical data to have a rolling forecast for 24 months into the future. The data can be extracted into excel and exported back into such ERP systems.
SKU Rationalization with life cycle planning
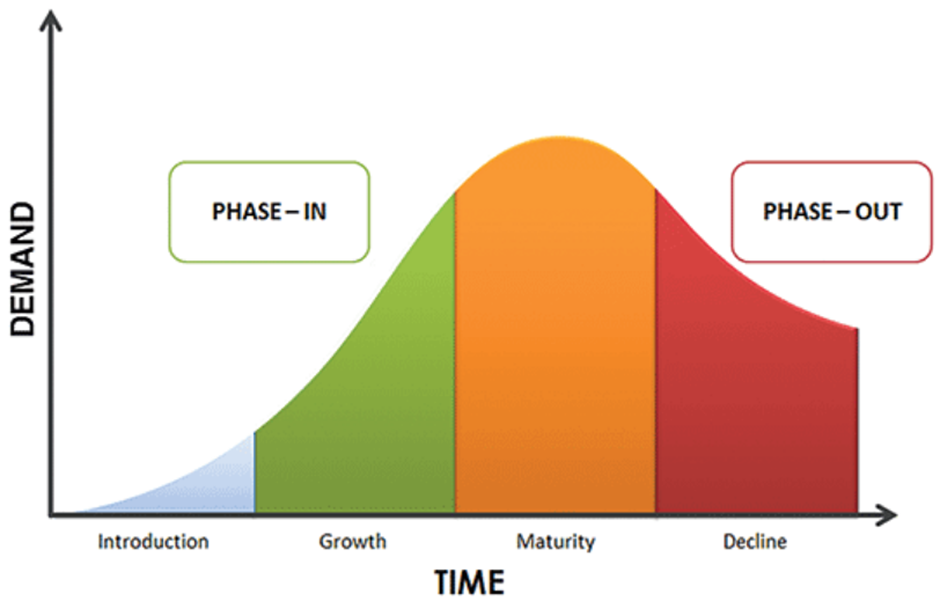
SKU rationalization is an analytical process used to determine the merits of adding, retaining, or deleting items from a manufacturers product assortment. An effective SKU rationalization program lays the groundwork for important initiatives, such as space planning and price optimization, and it’s used to improve product availability. There are different phases in a product life cycle – launch, growth, maturity & discontinuation. In ERP system, life cycle planning is integrated with univariate forecasting, causal analysis and composite forecasting. ERP system like SAP provides several tools to model a product lifecycle in Demand Planning e.g.,
-
- Like Modeling
This is used to carry out forecasting for new CVCs which have no historical data. Like profiles are set up to define how the history of the existing characteristics is to be used for new combinations.
-
- Phase-In/Phase-Out Profile
This helps to model the various phases in a product lifecycle. The demand for a product is different during various lifecycle phases, allowing to model based on demand trend during these phases over time. For a phase-in (of a new product) the aim is to have the forecast mimick the upward sales curve that we expect the product to display during phase-in.
-
- Aggregated Lifecycle Planning
This utilizes aggregation method. Therefore the key figures used for historical data and the forecast must sum the details at higher levels.
-
- Phase-In/Phase-Out Profile
This helps to model the various phases in a product lifecycle. The demand for a product is different during various lifecycle phases, allowing to model based on demand trend during these phases over time. For a phase-in (of a new product) the aim is to have the forecast mimick the upward sales curve that we expect the product to display during phase-in.
-
- Aggregated Lifecycle Planning
This utilizes aggregation method. Therefore the key figures used for historical data and the forecast must sum the details at higher levels.
An ERP application such as Oracle or SAP on the demand planning module would enable SKU rationalization strategies. There are benefits from such rationalization –
-
- Overall volume and revenue can be maintained while reducing manufacturing and/or purchasing costs.
-
- Increases forecasting accuracy by planning at a more aggregate level and focusing on fewer SKUs.
-
- Smaller set of SKUs allows for sales with a focussed approach.
-
- Funneling the SKUs allows the procurement team to negotiate better pricing with the higher volume purchases.
A mix of methods can be adopted for SKU rationalization such as SKU profitability analysis using Gross Margin Return on Investment Ratio (GMROI).
A good Sales & Operations Planning (S&OP) implemention can give multiple benefits –
-
- Forecast accuracy improvement 10 – 15%
-
- Inventory Reduction 5 – 10%
-
- Inventory Turnover Ratio Increase 5 – 10%
-
- Service Level Improvement 5 – 10%
-
- Top Line Revenue Improvement 2 – 5%
-
- SKU Rationalization 10 – 20%
Optimising inventory system with reorder levels
Reorder level (or reorder point) is the inventory level at which a company would place a new order or start a new manufacturing run. Reorder level depends on a company’s work-order lead time and its demand during that time and whether the company maintain a safety stock. Work-order lead time is the time the company’s suppliers take in manufacturing and delivering the ordered units. Predicting an optimal amount of stock for varying costumer demands is a critical component in balancing an operation’s inventory system. Your inventory system should act as a reserve of products to meet your sales needs, while minimizing the amount of cash you have tied up in inventory.
Identifying the correct reorder level is important. If a company places a new order too soon, it may receive the ordered units earlier than expected and it would have to bear additional carrying costs in the form of warehousing cost, opportunity cost, etc. However, if the company places an order too late, it would result in stock-out cost, e.g., lost sales. Any product that shows a trend in the time series plot gives a confidence for safety stock. If the lead times are reduced then the safety stock levels can be optimized thus reducing the likelihood and impact of stock out situations.
Reorder Level = (Average Demand × Lead Time) + Safety Stock
Reorder level depends on whether a safety stock is maintained or not. If the safety stocks are not maintained then the reorder levels can be calculated as
Reorder Level = Average Demand × Lead Time
Both demand and lead time must be in the same unit of time i.e. both should be in days or weeks.
The safety stocks can be calculated using the service levels since the service levels can be converted to a ‘z-score’. A z-score of 95% is equal to 1.64 & for a 90% service levels the z-score would be 1.29. The safety stocks can be calculated as
Safety Stock = Service Levels * Standard Deviation * Square root (Lead Time)
Rough Cut Capacity Planning – Integrating Capacity with Demand
After the demand planning process in complete there is a need to match the assets (capacity, material, people and supply). The objective is to meet the demand with the given available assets. Most organizations have a poor Sales & Operations planning with poor demand forecasts and far poorer capacity utilization. A rough-cut capacity plan assesses whether there is approximately enough capacity to manufacture what is needed, and gives an indication of how lumpy the demand on manufacturing is.
Identifying and generating actionable insights to resolve bottlenecks using key performance indicators for capacity planning. Some of the key performance indicators are Shippable volume per day, yield loss %, throughput (kilograms per hour), production efficiency, online ratio, first time quality, overall equipment effectiveness, cycle time, repair rate, mean cycle between failures, change over, daily volume per day, shippable%, installed capacity, downtimes will help improve capacity.
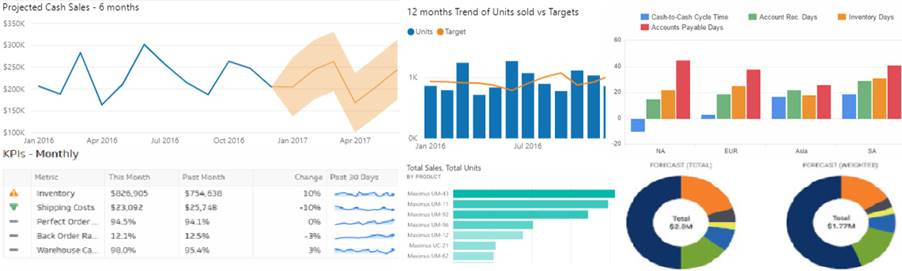
Performance Score Cards – Dashboards that cover key metrics related to Supply Chain
Real-time dashboards on key metrics for each business process in a supply chain will give good insights to decision makers to improve processes. Building data pipelines and extracting data into a data lake to make necessary data models for insights and prediction for making data enabled decisions.