
The Standard Normal Distribution is a normal distribution with a mean of 0 and a standard deviation of 1 i.e., a random variable X ~ N(0,1). All normal distributions can be transformed into the standard normal distribution using standardization.
Z score (standardization formula) The Z score for a given data point is the difference between that particular value and the mean, divided by the standard deviation. Z scores can help identify outliers. Values that are very different from the mean will have either very small (negative) Z score or very large (positive) Z scores. As a general rule, a Z score that is less than -3 or greater than +3 indicates an outlier value.
If X is normally distributed with mean μ and standard deviation σ, the standard normal variable Z is given by:
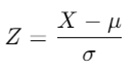
This transformation allows any normal variable to be converted into a standard normal variable, which simplifies calculations and use of standard normal tables.
Why use Standard Normal?
Simplification: Many statistical tables are based on the standard normal distribution, making calculations easier.
Comparisons: It allows for comparing different distributions on a common scale.
Normality Tests: In hypothesis testing, data is often assumed to be normally distributed, and the standard normal is used to calculate critical values.
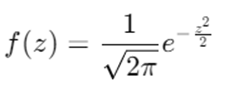
Probability Density Function (PDF)
The PDF for a standard normal distribution is
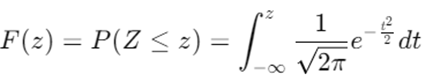
Cummulative Density Function (CDF)
In the normal distribution, we use the actual value for mean and standard deviation but in case of standard normal we set the mean and standard deviation to 0 & 1 respectively.
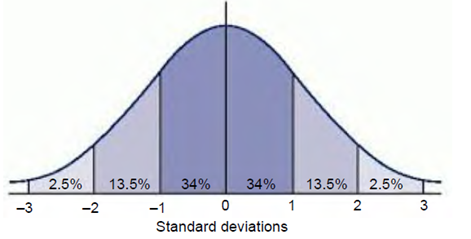
The normal curve showing that 95% (100 − 2.5 − 2.5) of the data are found between −2 and +2 standard deviations from the mean.
So, standard normal distribution allows us to calculate confidence intervals and test hypothesis.
Let us look at problem working with Z scores.
Time = 39, 29, 43, 52, 39, 44, 40, 31, 44, 35